
Analytics
Introduction
Analytics in Zinrelo provides a comprehensive overview of your loyalty program. The data can be exported for a detailed view of your program's performance, helping you optimize your loyalty strategies accordingly.
In this document, we will discuss the Analytics feature in more detail.
Please Note:
- All reports will be generated in your local timezone.
- All the dashboards under analytics section are refreshed twice a day (every 12 hours).
Dashboards
Dashboards give you a visual summary of how your program is performing. To access the dashboards, navigate to Analytics >> Dashboards.
The standard dashboards available for all customers include:
- Email Summary: This provides a comprehensive overview of emails sent from your loyalty program. You can check the total number of emails sent, opened, clicked, bounced, and more.
- Members: This dashboard offers a detailed view of your members. You can see trends of active, churned, and inactive members, their status, tiers, and engagement with the loyalty program.
- Points Accounting: Here, you get a detailed view of total points earned, redeemed, deducted, and expired.
- Referral: This section allows you to check referral details, including how many members were referred, emails sent to them, and more.
- Value: This dashboard provides insights into the total revenue earned through transactional activities.
By utilizing these dashboards, you can gain valuable insights into various aspects of your loyalty program, enabling you to make data-driven decisions and improve overall performance. The platform has the capability to enable custom reports as well. You can contact your account manager at [email protected] for details on custom reports.
Data Exports
We have two types of exports: standard export and custom export. These exports serve as powerful tools to gain valuable insights and analytics pertaining to different aspects of your loyalty program.
Standard Export Reports
Standard Exports are pre-built exports. It would describe the specific exports, their functionalities, and the types of insights they offer, such as member enrollment, redemption distribution, activities distribution, and points balance export reports.
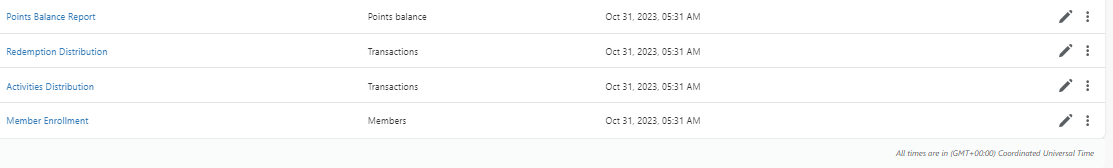
- Member Enrollment Data Export: These reports provide valuable insights into new member enrollments within your loyalty program. These reports allow you to analyze the data based on specific timeframes, such as daily, monthly, or yearly. By accessing Member Enrollment Reports, you can gain a comprehensive understanding of the number of new members who have joined your program during a given period.
- Redemption Distribution Data Export: These reports provide valuable information about the distribution of redemptions based on specific redemption IDs within your loyalty program. These reports offer a count of the number of redemptions made for each redemption ID.
- Activities Distribution Data Export: These reports offer valuable insights into the distribution of activities performed within your loyalty program based on specific activity IDs. These reports provide information on the number of times each activity has been completed by members.
- Points Balance Data Export: These reports serve as essential tools for bookkeeping purposes. These reports provide valuable insights into various aspects of point balances, including the opening point balance, total awarded points, total deductions, total expired points, and total redeemed points, all accompanied by their respective transaction dates.
Note: These reports can be edited as needed by clicking on the "Edit" icon.
Custom Reports
Custom reports give you flexibility to access all your data, including any custom fields that you have created in your loyalty account. In this section, we will know how to create loyalty program reports using the Zinrelo platform.
How do I create a custom reports?
Step 1: Click on "Reports" >> "Create Report."
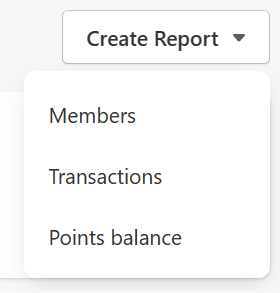
Step 2: Select from the given category- Members, Transactions & Points Balance
Step 3: Add “Report Name” and “Report Description.”
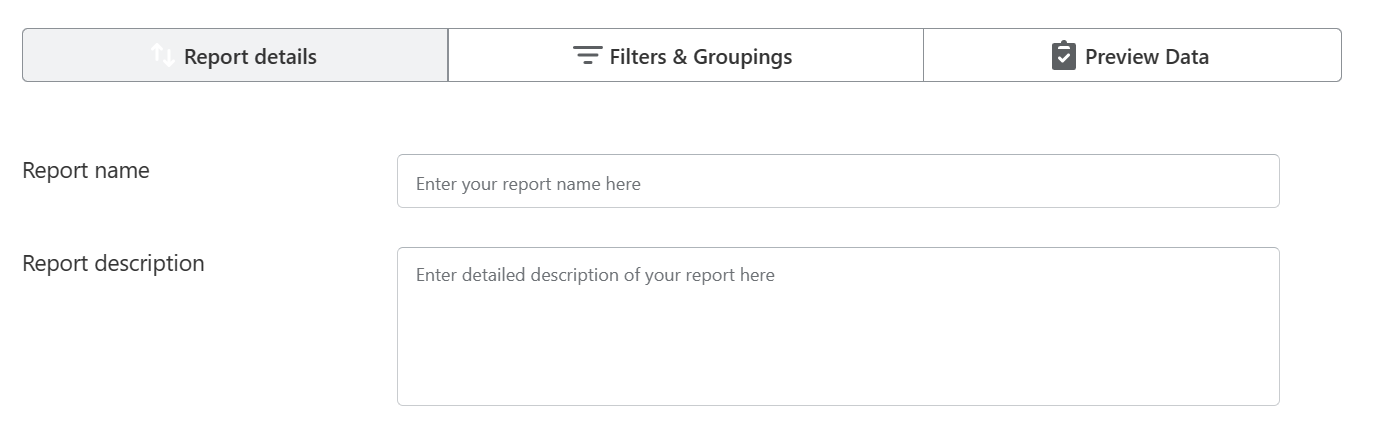
Assign a name and description to the report. The name will be visible in the report section, where all reports are listed.
Note: “Report Name” and “Field Output Columns” are mandatory.
Step 4: Choose the appropriate filters and groupings.
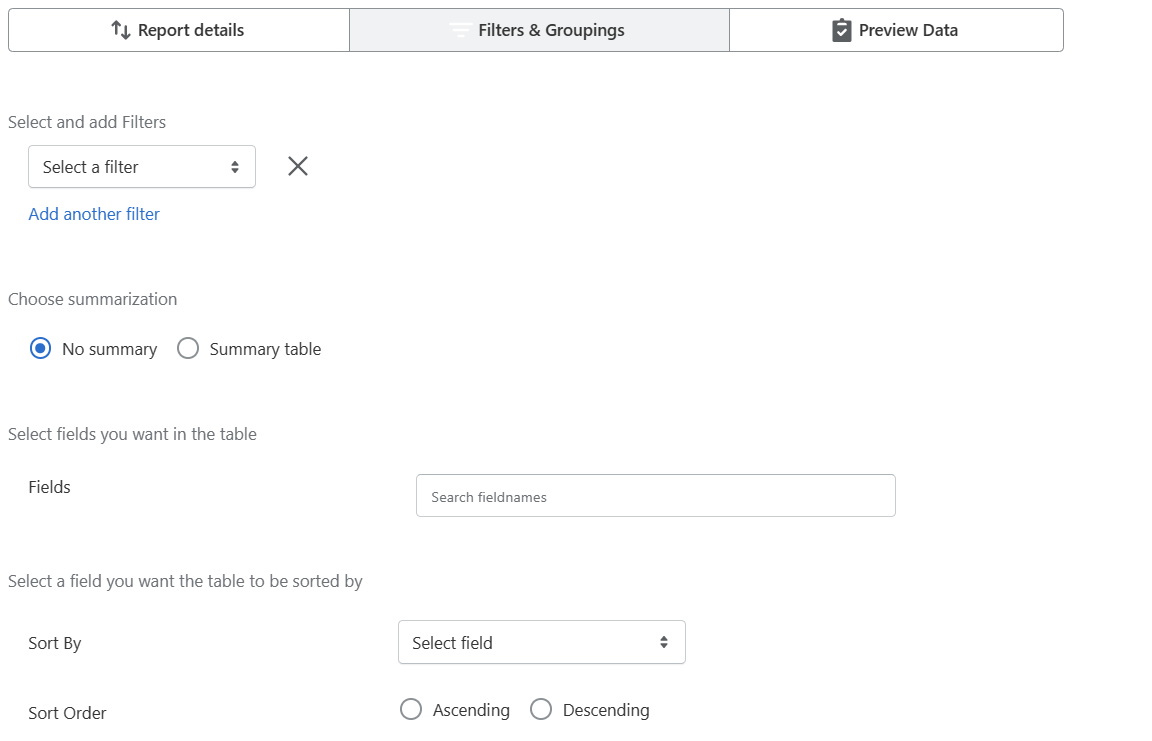
After the report details are entered, the next step is to apply filters to the report if any.
Multiple filters can be included with the ‘Match Any’ or ‘Match All’ logic.
The report can be filtered based on any field from the collection. The type of filter will change based on the data type.
- String Filters
- In
- Not In
- Blank
- Not Blank
- Date Filters
Absolute
- After
- On
- Before
- Between
Relative
- More than_days ago
- Less than_days ago
- Exactly_days ago
- More than_days after
- Less than_days after
- Exactly_days after
- Today
- This month
- This quarter
- This year
- Yesterday
- Last month
- Last quarter
- Last year
- Tomorrow
- Next month
- Next quarter
- Next year
- Numeric Filters
- Equals
- Between
- Greater than
- Lesser than
Step 5: Summary Data

After the report category and filters are decided, you can decide how the data needs to be presented.
There will be 2 options here:
No Summary: The use case here is to export the raw data. The report table will list each record in the underlying collection. You can select which columns you want to have in the view.
Summary Table: The permitted summarizations are 'SUM', 'AVERAGE', 'MIN', 'MAX' for Integer data types and 'COUNT', 'DISTINCT COUNT' for string data types. Also, you have an option to rename the summary columns.
- You can select any columns from the chosen collection. The chosen columns will be added to the table. The rows of the table will list the unique value combinations for chosen columns. Summary columns added after the data columns will show the summary measures for the unique combinations of the earlier data columns.
- Instead of adding data columns, you can directly choose the summary measure. The table will contain a single row showing the summary values of the respective summary columns.
Step 5: Preview the data.
You can preview the report before saving it.
Use Cases
Category- Members
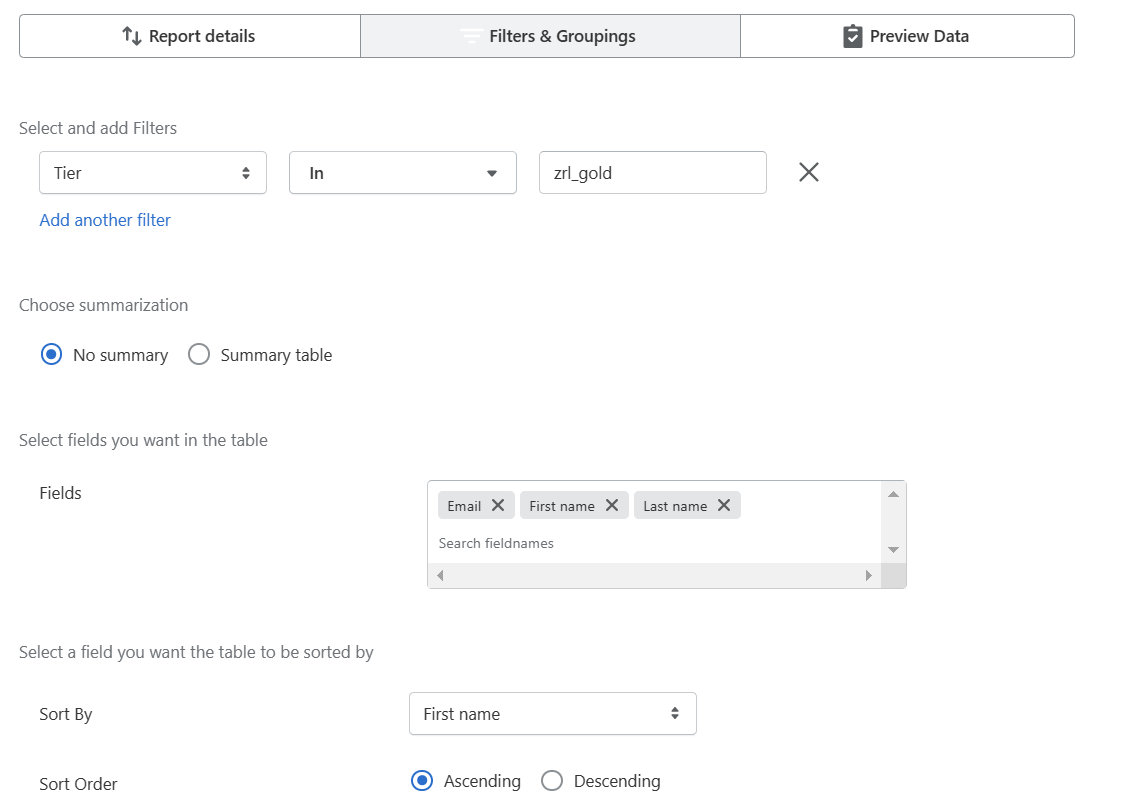
Use Case 1: A company wants to populate the data to know the name and email address of all the gold tier users.
Application:
Step 1: Select the filter “tier” and operator “in” for the Gold tier.
Step 2: Select “No Summary.”
Step 3: Select the field you want in the table- email, first name, and last name.
Step 4: Select a field you want the table to be sorted by-Ascending or Descending.
Step 5: Preview the Data.
Step 6: Save the Report.
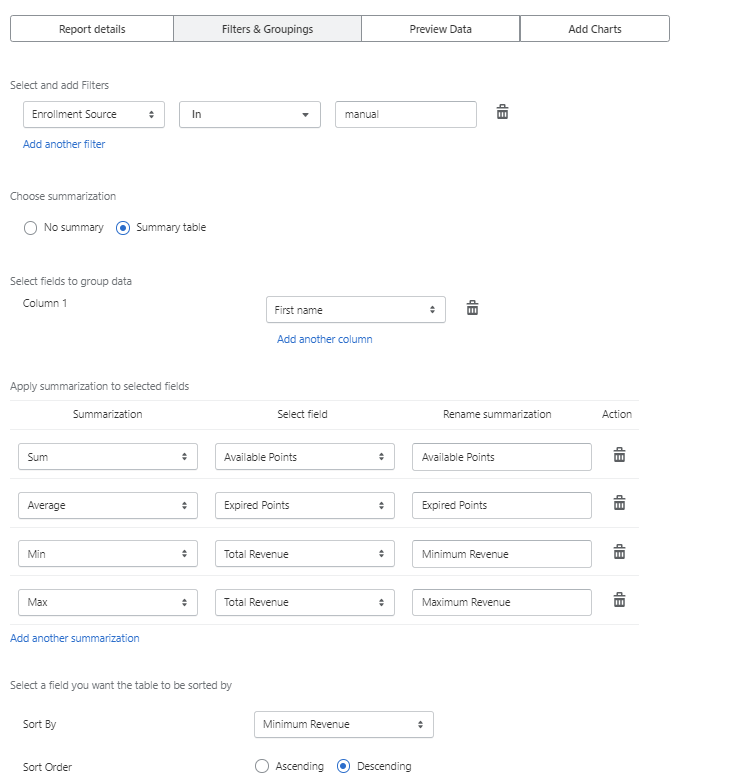
Use Case 2: The company wants to populate the data to find out the total number of available points, the average number of expired points, and the minimum and maximum revenue of all front-end enrolled members.
Application:
Step 1: Select the "enrollment source" - "manual" filter.
Step 2: Choose summarization - “Summary Table.”
Step 3: Select fields to group data - “First Name.”
Step 4: Apply summarization to selected fields.
Step 5: Select a field you want the table to be sorted by-Ascending or Descending.
Step 6: Preview the Data.
Step 7: Save the report.
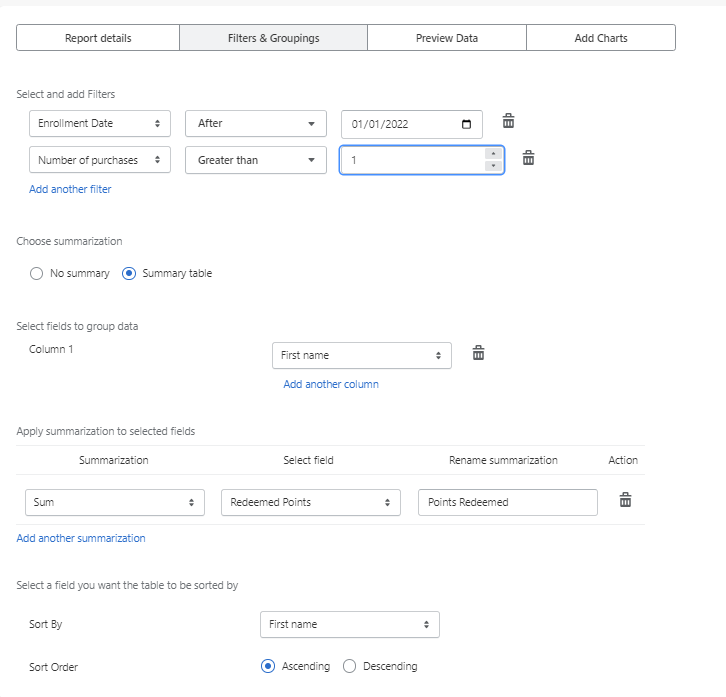
Use Case 3: A company wants to populate the data to know the sum of redeemed points made by all users who were enrolled after the year 2022 and have made a purchase more than once.
Application:
Step 1: Apply the filter to “Enrollment Date” and “Number of Purchases.”
Step 2: Choose summarization – “Summary Table.”
Step 3: Select fields to group data – “First Name.”
Step 4: Apply summarization to selected fields.
Step 5: Select a field you want the table to be sorted by-Ascending or Descending.
Step 6: Preview the data.
Step 7: Save the Report.
Category- Transaction
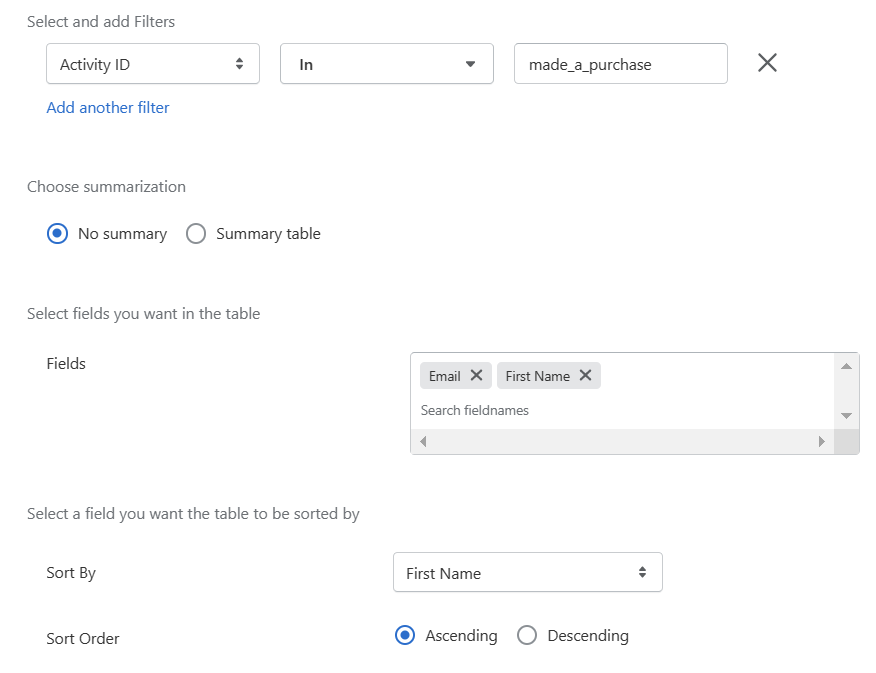
Use Case 1: A company wants to populate the data to know the email address and name of all the users who have performed the “made_a_purchase” activity.
Application:
Step 1: Select and add filter- “made_a_purchase.”
Step 2: Choose Summarization- “No Summary.”
Step 3: Select the fields you want to add to the table- “email address” and “first name.”
Step 4: Select a field you want the table to be sorted by-Ascending or Descending.
Step 5: Preview the Data.
Step 6: Save the report.
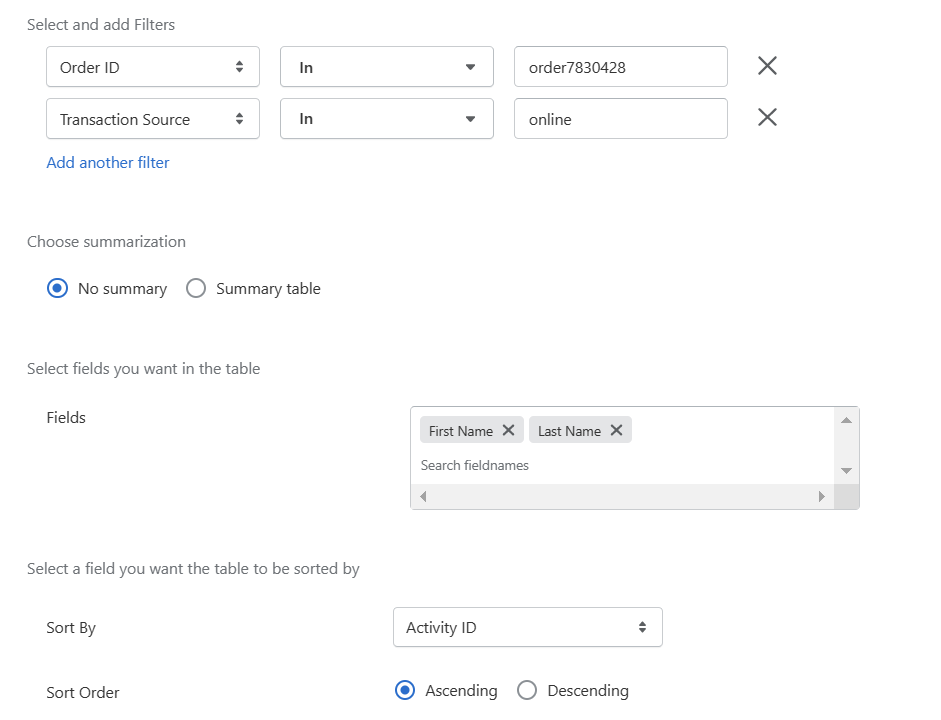
Use Case 2: A company wants to populate the data to know the name of the users who have returned the product with the “order7830428” ID.
Application-
Step 1: Select and add a filter.
Step 2: Choose Summarization- “No Summary.”
Step 3: Select the fields you want to add to the table- “first name” and “last name.”
Step 4: Select a field you want the table to be sorted by-Ascending or Descending.
Step 5: Preview the data.
Step 6: Save the report.
Use Case 3: A company wants to populate the data to know the available points for all users for all awarded transactions.
Application:
Step 1: Select and add the filter- “Transaction type.”
Step 2: Choose Summarization- “Summary Table.”
Step 3: Select fields to group data- “First Name.”
Step 4: Apply summarization to selected fields-
Step 5: Select a field you want the table to be sorted by-Ascending or Descending.
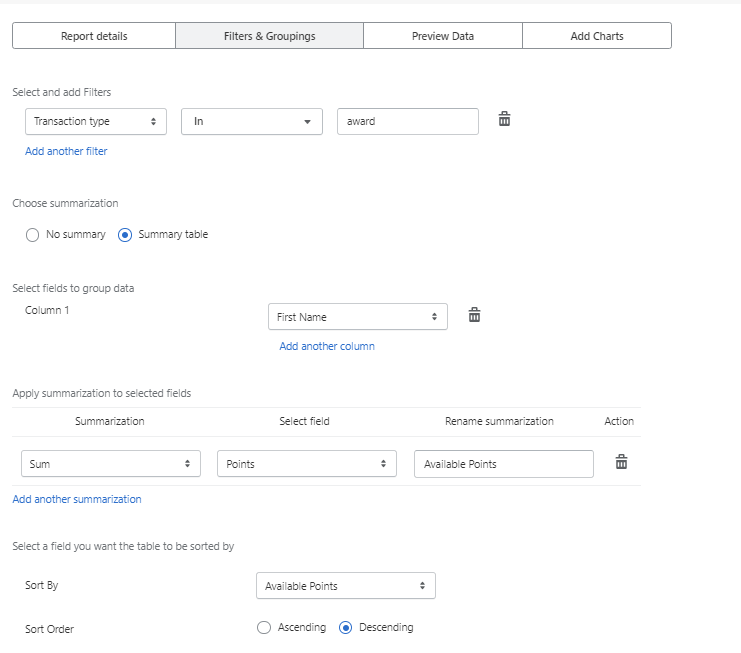
Step 6: Preview the data.
Step 7: Save the report.
Please Note:Within the transaction report, you can include transaction and member attributes as part of the filtering criteria.
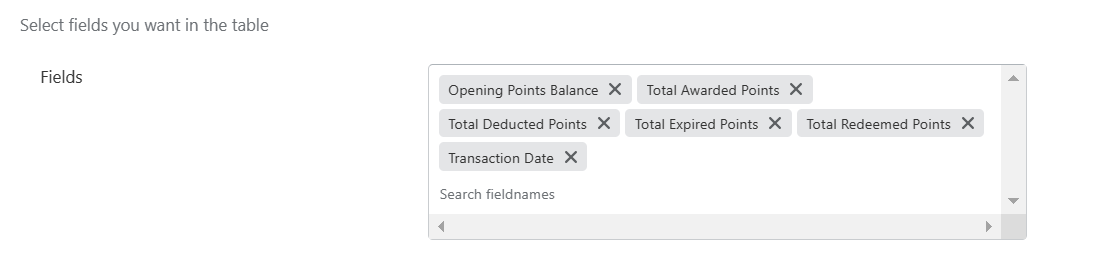
Category- Points Balance
Use Case: A company’s account manager needs data to update the book of accounts.
Application:
Step 1: Select the fields you want in the table- all the fields that are required for bookkeeping.
Step 2: Preview the data.
Step 3: Save the report.
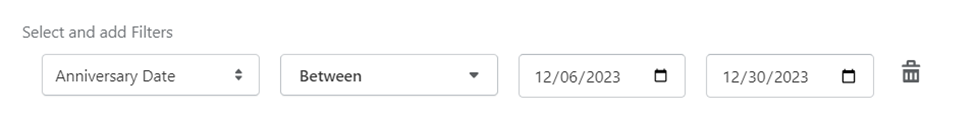
Please Note:
When specifying a date range, the concluding date will be inclusive.
For instance, in a range such as December 30th, data from that specific date will also be encompassed within the selection.
Updated 2 months ago